SQL queries in the management console
Managed Service for PostgreSQL allows you to:
- Visualize the structure of the data and the query execution plans in your PostgreSQL cluster.
- Run SQL queries against databases from the Yandex Cloud management console.
Warning
The SQL editor built into the management console is designed for a narrow range of data editing tasks. Some parameter values can be replaced by the editor's defaults.
For working with databases, we recommend third-party editors or Yandex WebSQL. To use Yandex WebSQL, click Open on a promo banner and connect to a DB cluster.
You cannot use SQL commands to do anything that requires superuser access.
To connect to a Managed Service for PostgreSQL cluster and manipulate its data from the management console:
- Go to the folder page and select Managed Service for PostgreSQL.
- Click the cluster name.
- Enable the Access from the management console option if it is not enabled yet.
- Select the SQL tab.
Authentication
Every time you open the SQL tab, you must enter the cluster user's username and password and select the database to connect to. This will open the database structure and the SQL query input window.
Tip
To avoid having to enter your password too frequently, open this management console page in a new browser tab.
See a reference list of supported queries in the PostgreSQL documentation.
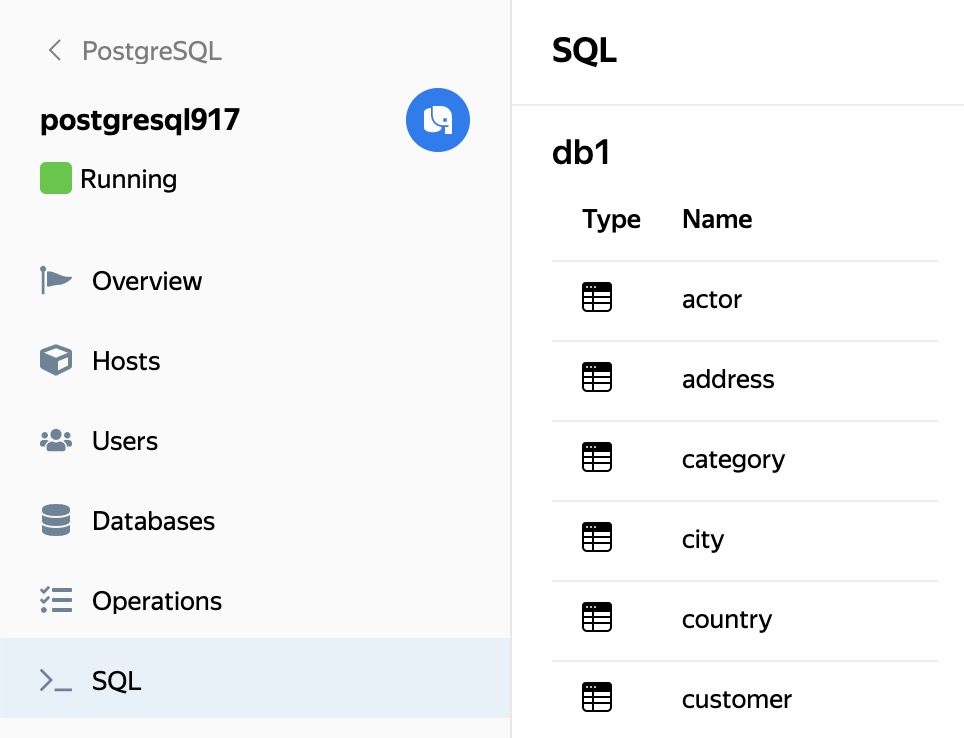
Data structure visualization
Once you have logged in, you can see the structure of the selected database and its tables:
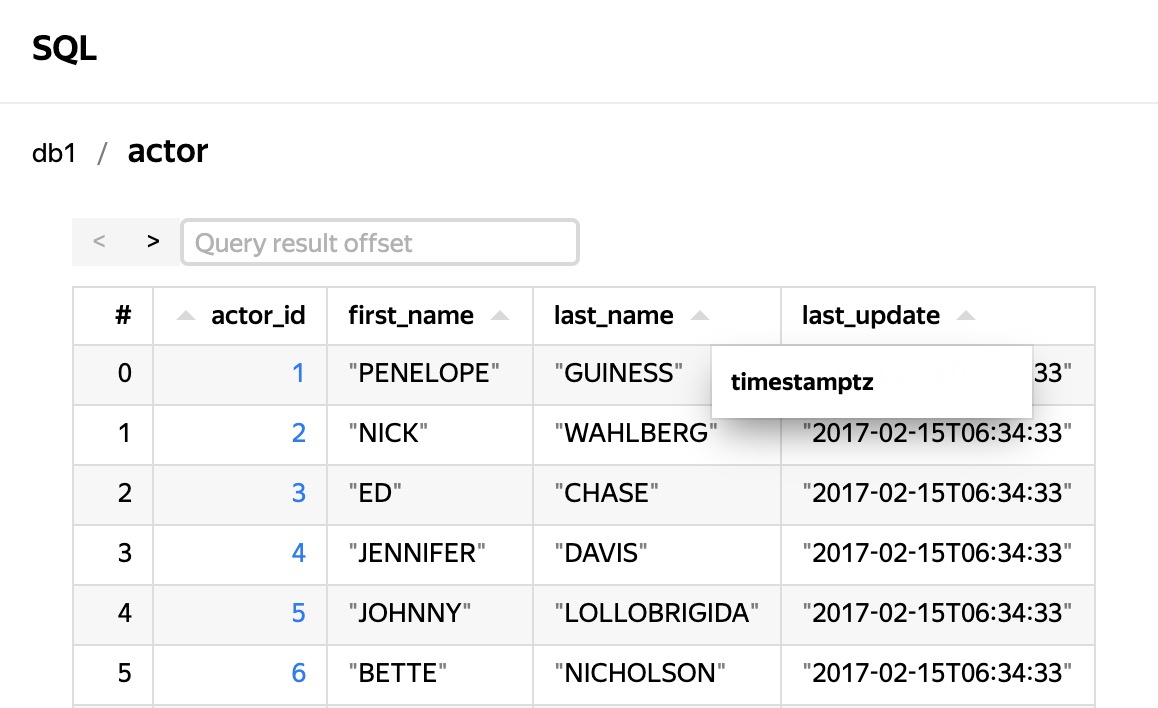
Click the table to see the first 1,000 rows of the SELECT * query result for this table, 20 rows per page (the management console does not support full navigation through all the DB data). In the Query result offset field, you can set the offset for showing the results table.
Hover over the column header to see the type of column data:
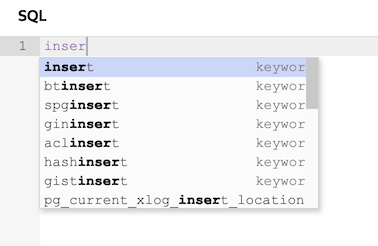
SQL queries
The query input window is open on the right. Start typing your query to see suggested keyword options:
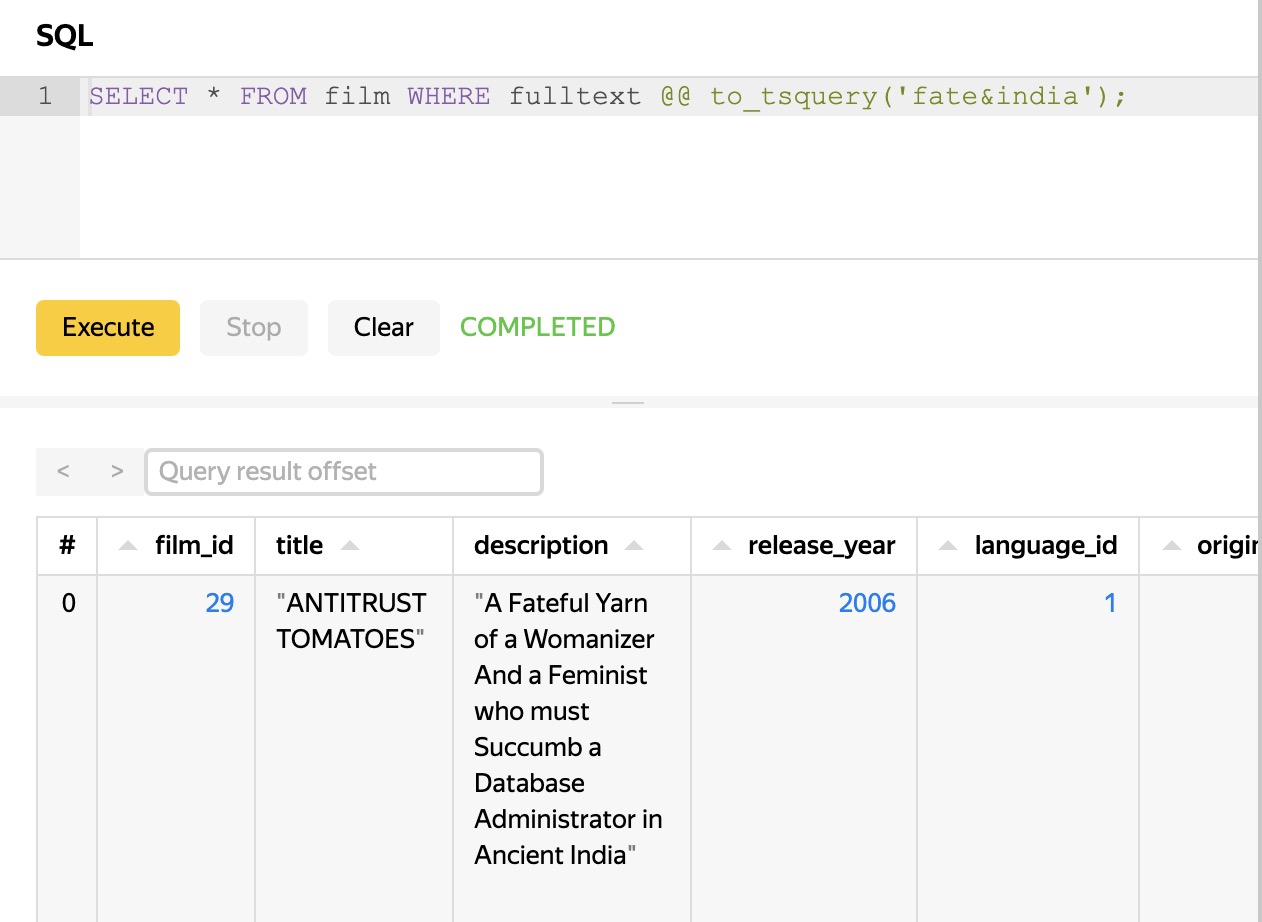
Enter a query and click Execute. The results table or error message is shown in the results panel that is under the editor control buttons.
Query analysis
To display a visualization of a SQL query execution plan:
-
Enter your query.
-
Click the drop-down menu button next to Execute.
-
Choose the visualization method:
- Explain analyze: A query is executed using
EXPLAIN ANALYZE. The query plan is based on the data received during the execution. The tabs will display accurate information about the query properties:- Cost: Cost of parts of a query (in relative units).
- Time: Time to execute an entire query and its component parts.
- Buffers: Information about I/O operations and RAM usage for each part of a query.
- Explain: A query does not execute, and its plan is built using the
EXPLAINcommand based on the statistics collected by PostgreSQL. The Cost tab displays a rough estimate of the cost of the entire query and its parts (in relative units).
In both cases, slow and resource-consuming parts of the query will be highlighted.
For more information, see the PostgreSQL documentation:
- Explain analyze: A query is executed using
-
To view a detailed query execution plan as a tree, click . To exit this mode, press Esc.
Each part of a query displays as a box showing the absolute and relative execution times. If one part of a query takes much longer to execute than the others or uses resource-heavy operations, the box will be marked with labels showing the reason.
To get more detailed information about a part of a query, click the required box, and it will display a panel with the following tabs:
- Stats: Execution cost (in relative units).
- I/O & Buffers: Information on I/O operations and RAM usage.
- Misc: General information regarding a query, such as a list of the fields involved.
- Info: Supplemental information, such as the names of the tables and indexes queried.
Query restrictions in the management console
- If you close or reload the page, the query text and its results are lost. In this case, each query that you run from the management console will be executed regardless of the browser state.
- The management console outputs only the first 1,000 rows of the result.
- If a cluster query takes more than 10 minutes, the management console reports an error instead of outputing the result, even if the query eventually finishes processing.
- If your cluster has multiple PostgreSQL hosts, queries from the management console are sent to the current master host.
- The list of tables is taken from the public schema. You can make queries to tables from other schemas by explicitly specifying the schema, for example:
SELECT * from information_schema.column_udt_usage.