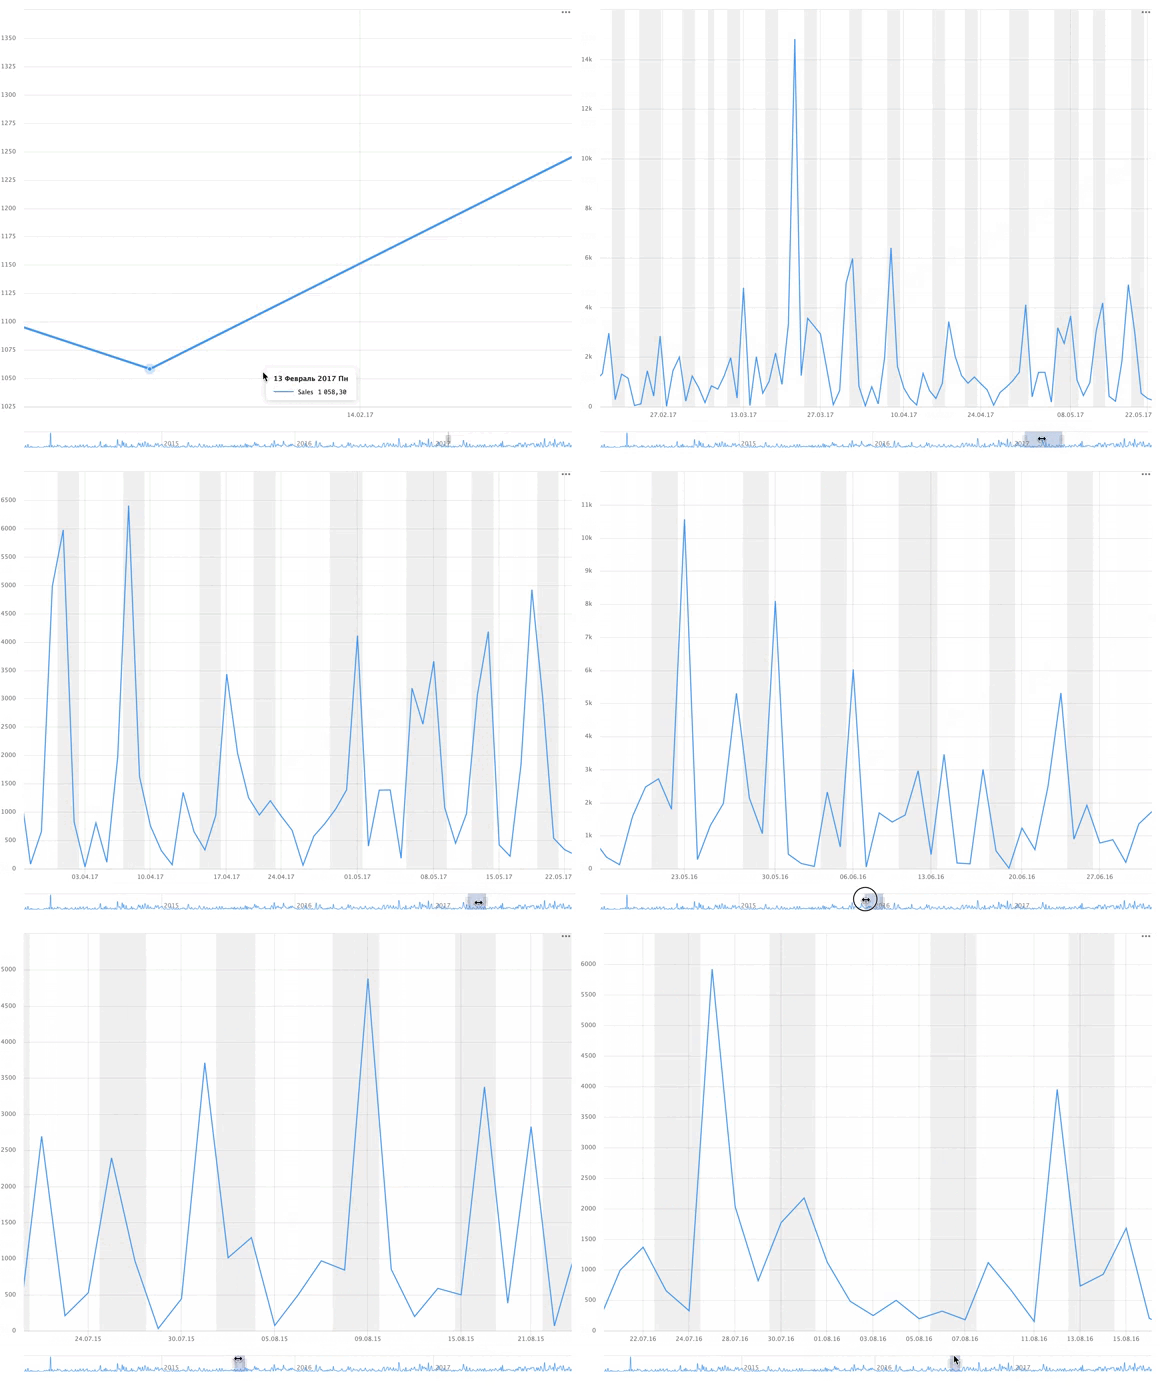
Configuring the navigator
Note
The navigator is available for those charts from the list that have a field of the Date or Date and time type in their X section:
To set up the navigator:
Warning
If you use a new DataLens object model with workbooks and collections:
- In the left-hand panel, select
- Open the appropriate workbook and select an object.
Follow the guide from step 2.
-
In the left-hand panel, click
-
On the left side of the screen above the chart, click
-
In the Chart settings window, enable the Navigator option.
-
Select the navigator display mode:
- All lines to display all chart lines in the navigator.
- Choose lines to display the chosen lines in the navigator.
-
Specify the Default period. Each time you open the chart, the last period corresponding to this setting is displayed. Set
0or leave the field empty to display the entire range of values. -
Click Apply. The navigator is displayed at the bottom of the chart.
 .
.