Creating a multi-dataset chart
Note
In multi-dataset charts, only linked dimensions (available in all datasets) can be used.
To create a multi-dataset chart:
Warning
If you use a new DataLens object model with workbooks and collections:
- Go to the DataLens home page. In the left-hand panel, select Collections and workbooks.
- Open the workbook, click Create in the top-right corner, and select the appropriate object.
Follow the guide from step 3.
-
Go to the DataLens home page.
-
Click Create chart.
-
Under Dataset, select a dataset for visualization. If you do not have a dataset, create one.
-
Add another dataset. To do this, under the dataset list, click Add dataset and select the dataset to visualize.
-
When you add a dataset, a link is automatically created based on the first field name and data type match. In the dataset link configuration window that opens, click Save.
-
Repeat steps 3-4 as required.
-
Select your chart type, such as Line chart.
-
Drag one of the linked dimensions to the X section. The values will be displayed in the lower part of the chart on the X axis.
-
Drag measures from different datasets to the Y section. The values will be displayed as charts on the Y axis.
-
Drag a dimension or measure from the dataset to the Filters section. The field can be empty. In this case, no filters are applied.
Example of creating a multi-dataset chart
As an example, we will use free datasets from the marketplace as the data source:
-
Deploy the marketplace dataset named Coronavirus. Dashboard and data.
-
Similarly, deploy the marketplace dataset named Weather.
-
Use the left-hand navigation panel to switch to the Datasets section and select the Isolation Daily dataset.
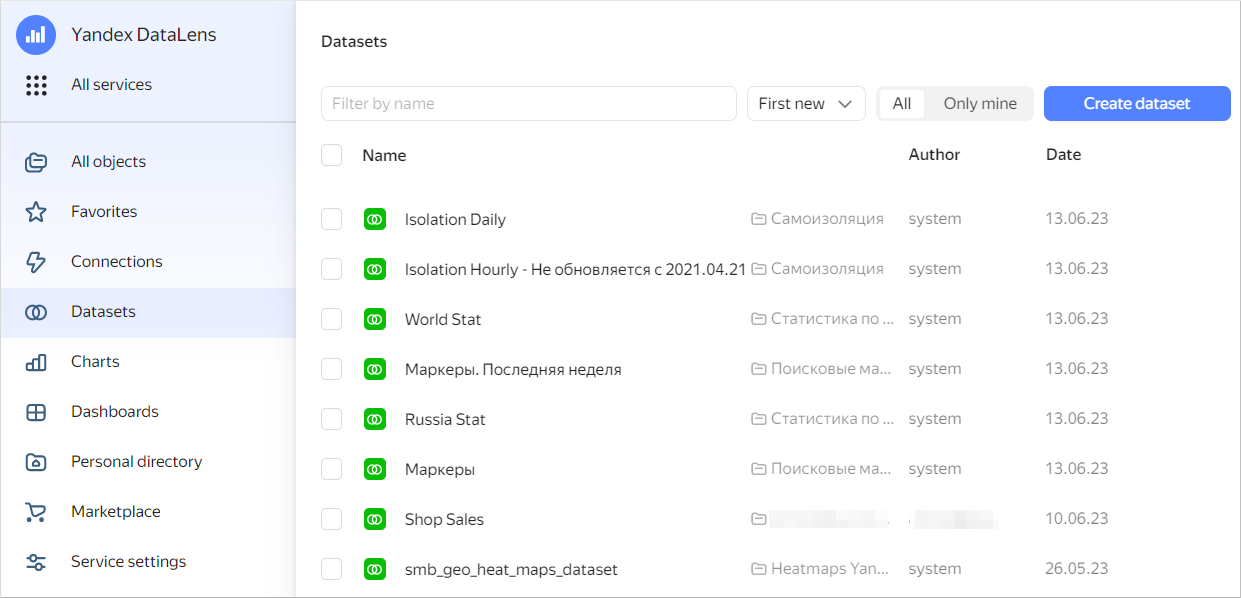
-
At the top right, click Create chart.
-
Select Line chart as your chart type.
-
Drag the
Datedimension to the X section. -
Drag the
Citydimension to the Filters section. Select a value, e.g.,Moscow. -
Drag the
Indexmeasure to the Y section. The resulting chart displays changes to the self-isolation index in Moscow.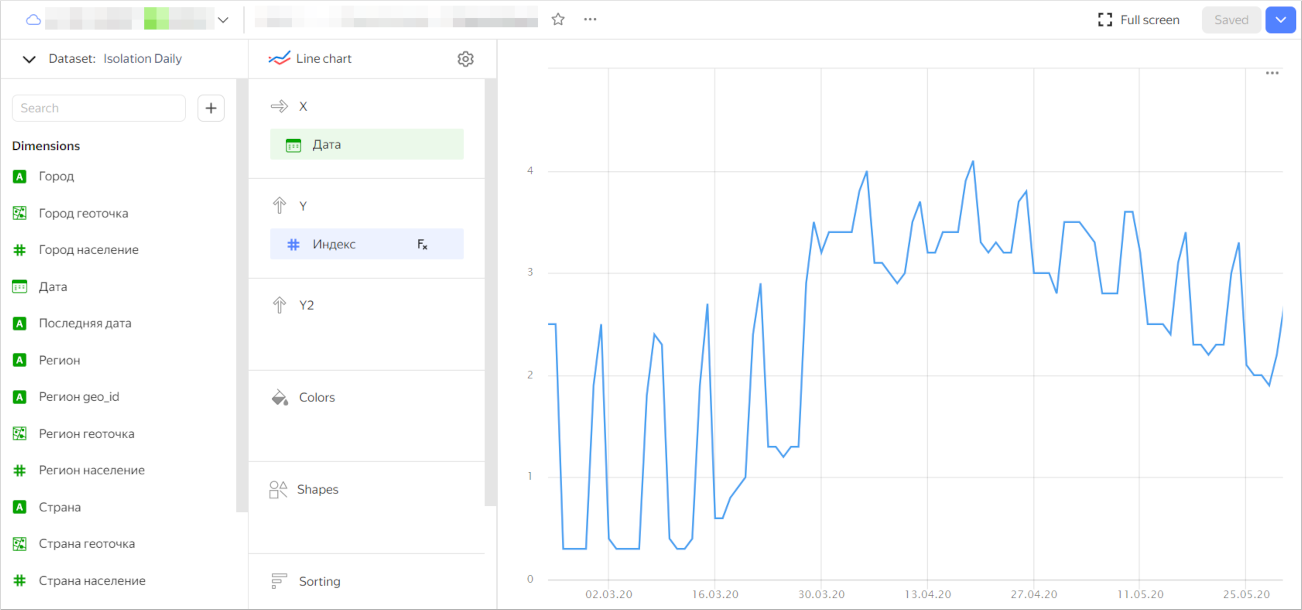
-
At the top left of the screen, click in front of the Dataset: Isolation Daily field.
-
Click Add dataset and select the Weather dataset.
-
In the window that opens, make sure the links are set by the
Date,City, andCountryfields.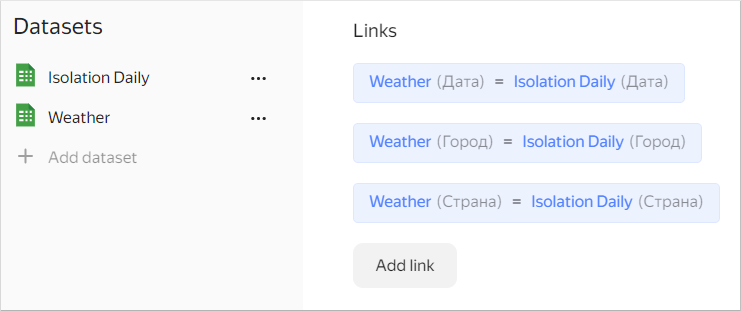
-
In the chart dataset list, select Weather.
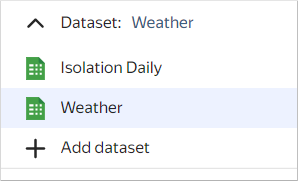
-
Drag the
Average temperaturemeasure to the Y2 section. -
Drag the
Datedimension to the Filters section. Set the condition:later than February 21, 2020(date from which the self-isolation index is calculated). -
At the top right, click Save. Enter the chart name and click Save.
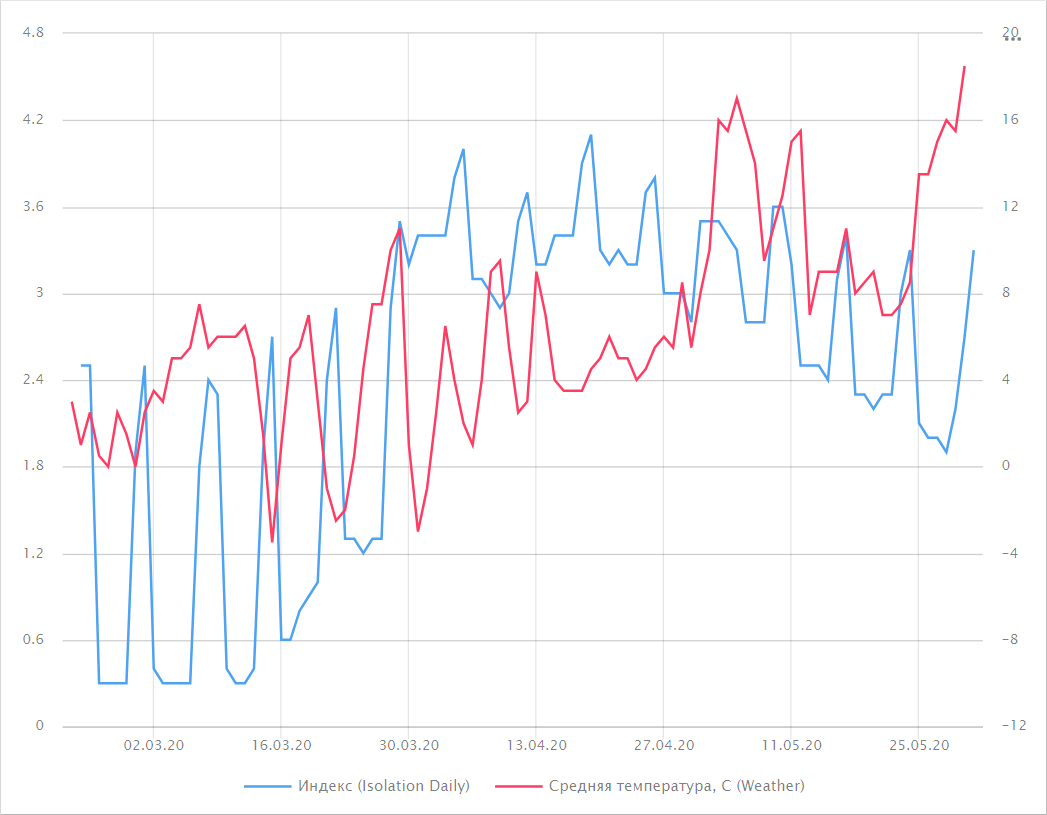
The resulting chart visualizes data from the two datasets and allows comparing the weather and self-isolation data.
Example of creating a multi-dataset chart with SQL queries
We'll use a demo ClickHouse® database with sales data from a Moscow store chain as our data source. For an example of creating a connection, see this guide.
-
Build two datasets using a SQL query against the data source:
-
SQL query code for the
count_client_sqldataset:SELECT samples.MS_Shops.ShopName, count(t2.ClientID) AS count_clients FROM samples.MS_Shops, (SELECT DISTINCT samples.MS_Shops.ShopID, samples.MS_Shops.ShopName, samples.MS_SalesFacts.ClientID FROM samples.MS_SalesFacts INNER JOIN samples.MS_Shops ON samples.MS_Shops.ShopID=samples.MS_SalesFacts.ShopID) AS t2 WHERE t2.ShopName=samples.MS_Shops.ShopName GROUP BY ShopName -
SQL query code for the
count_sales_sqldataset:SELECT DISTINCT samples.MS_Shops.ShopName, COUNT(*) AS count_sales FROM samples.MS_SalesFacts INNER JOIN samples.MS_Shops ON samples.MS_Shops.ShopID=samples.MS_SalesFacts.ShopID GROUP BY ShopName
-
-
On the DataLens home page, click Create chart.
-
Under Dataset, select the
count_client_sqldataset.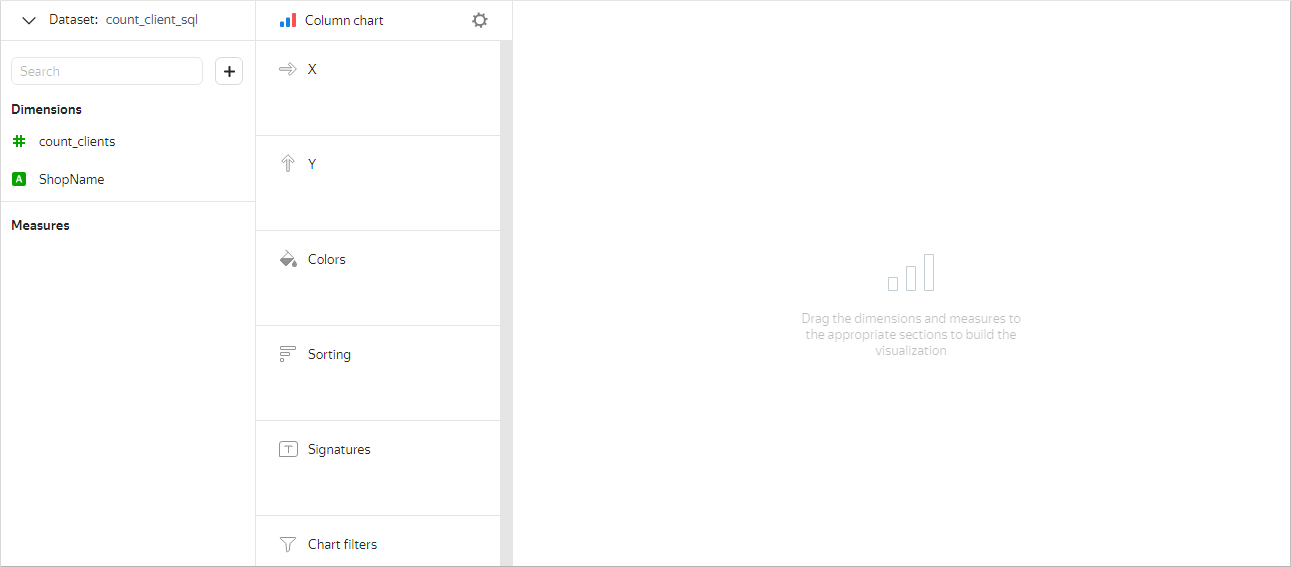
-
Select Line chart as your chart type.
-
Drag the
ShopNamedimension to the X section. The values are displayed in the lower part of the chart on the X-axis. -
Drag the
count_clientsindicator from your dataset to the Y section. This will display the values along the Y axis as a chart.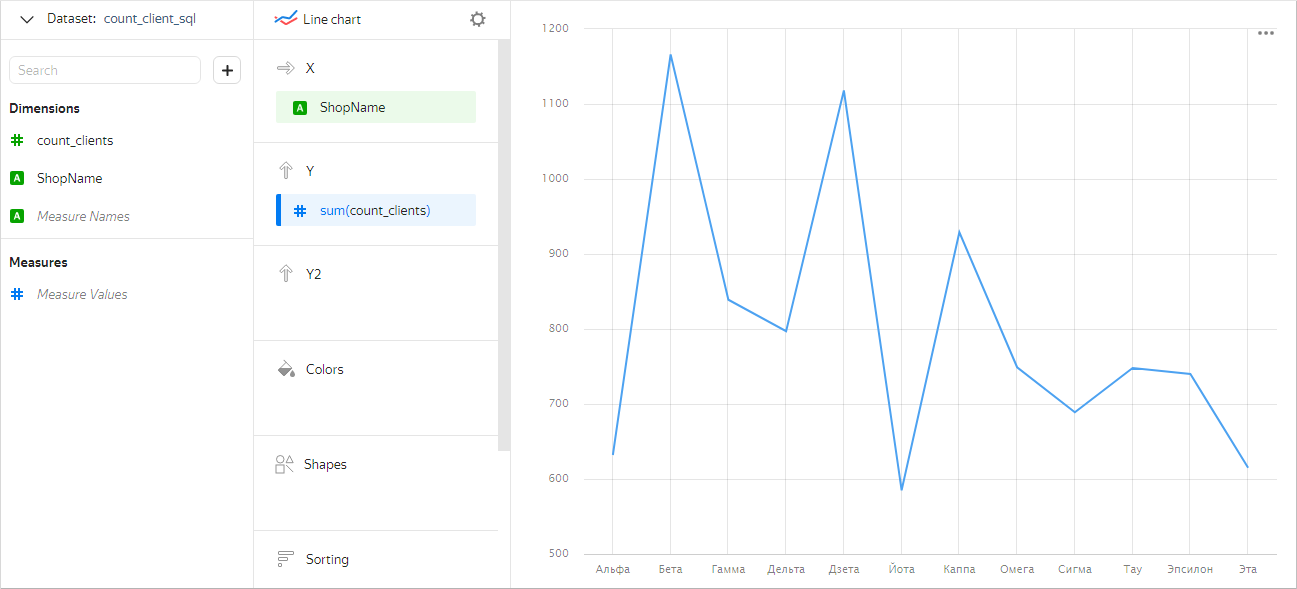
-
Under the dataset list, click Add dataset and select
count_sales_sql. -
In the resulting window, a link is automatically created based on the
ShopNamefield. Click Save.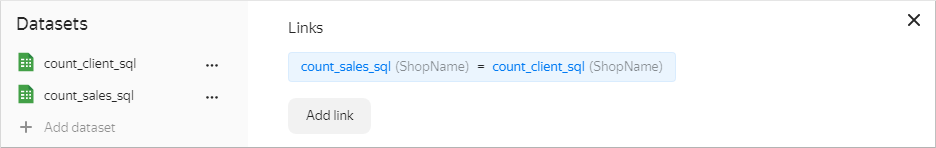
-
Drag the
count_salesindicator from your dataset to the Y section. This will display the values along the Y axis as a second chart.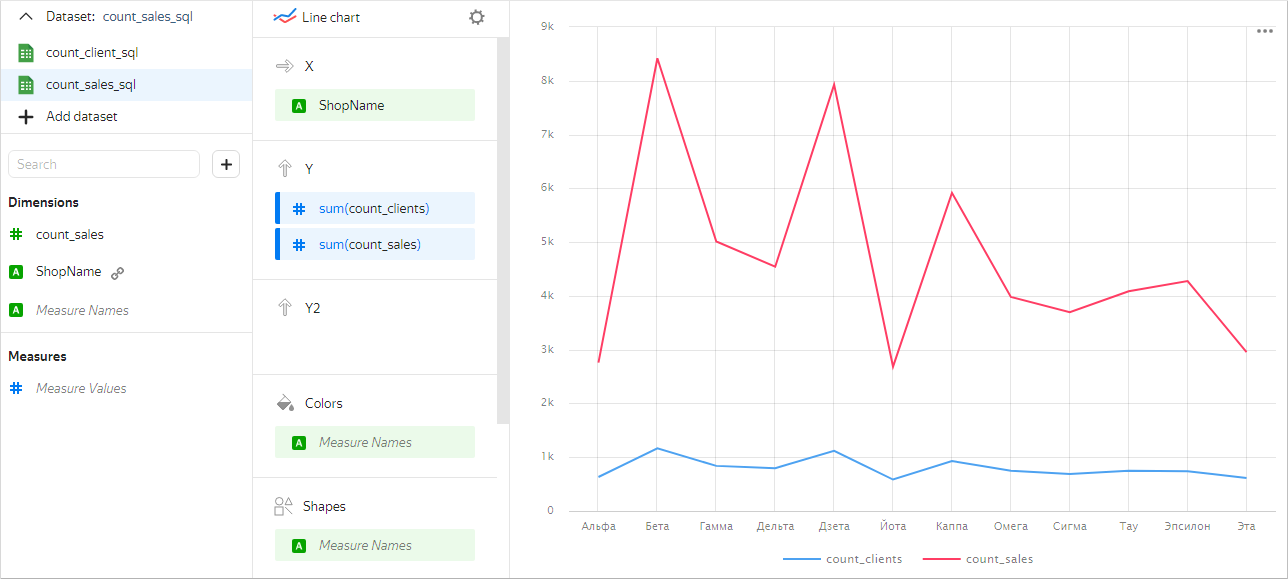
-
At the top of the screen, click Save. In the resulting window, enter the following name for the chart:
Customers and sales by store - Line chart. Then click Save.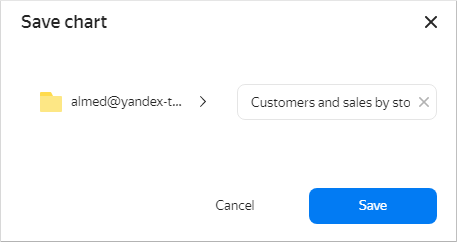
ClickHouse® is a registered trademark of ClickHouse, Inc.