Yandex Cloud
  • Services
  • Solutions
  • Why Yandex Cloud
  • Blog
  • Pricing
  • Documentation
  • Contact us
Get started
Language / Region
Yandex project
© 2023 Yandex.Cloud LLC
Yandex DataLens
  • Getting started
  • Practical guidelines
    • All tutorials
    • Visualizing data from a CSV file
    • Creating and publishing a chart with a map of Moscow from a CSV file
    • Analyzing a retail chain's sales from a ClickHouse database
    • Analyzing public data on road accidents in Russia
    • Analyzing sales and locations of pizzerias based on data from ClickHouse DB and Marketplace
    • Web analytics with a connection to Yandex Metrica
    • Web analytics with funnels and cohorts calculated based on Yandex Metrica data
    • Mobile app analytics based on AppMetrica data
    • Analyzing Yandex Music podcast statistics (for podcasters)
    • Visualizing data with a QL chart
    • Visualizing data using parameters
    • Visualizing Yandex Monitoring data
    • Building customer journey charts based on AppMetrica data
  • Concepts
    • Service overview
    • Organizations in DataLens
    • Connection
    • Data types
    • Datasets
      • Overview
      • Data model
      • Dataset settings
    • Charts
      • Overview
      • Chart settings
      • Measure Values and Measure Names
    • Dashboards
    • Joining data
    • Using Markdown in DataLens
    • DataLens Public
    • Calculated fields
      • Overview
      • Formula syntax
    • Parameterization
    • Marketplace
    • Backups
    • Caching
    • Quotas and limits
  • Step-by-step instructions
    • All instructions
    • Working with connections
      • Creating a ClickHouse connection
      • Creating a connection to a file
      • Creating a Google Sheets connection
      • Creating a MySQL connection
      • Creating a PostgreSQL connection
      • Creating a SQL Server connection
      • Creating a BigQuery connection
      • Creating an Oracle Database connection
      • Creating a YDB connection
      • Creating a Greenplum® connection
      • Creating a Prometheus connection
      • Creating a Yandex Monitoring connection
      • Creating a Yandex Metrica API connection
      • Creating an AppMetrica connection
      • Creating a Yandex Cloud Billing connection
      • Managing connection access
    • Working with datasets
      • Creating a dataset
      • Combining data from multiple tables
      • Creating a data field
      • Creating a calculated data field
      • Creating a default filter for new charts
      • Updating fields in datasets
      • Describing a dataset via a source SQL query
      • Managing dataset access
      • Managing access to data rows
      • Adding parameters to a dataset
    • Working with charts
      • Creating a chart
      • Creating a QL chart
      • Creating a multi-dataset chart
      • Adding a hierarchy
      • Configuring the navigator
      • Publishing a chart
      • Managing chart access
      • Adding ID as a parameter
      • Adding parameters to a chart
      • Configuring the display of null values
    • Working with dashboards
      • Creating dashboards
      • Adding charts to dashboards
      • Adding selectors to dashboards
      • Creating an alias
      • Deleting an alias field
      • Publishing dashboards
      • Managing dashboard access
      • Adding parameters to a dashboard
      • Dashboard auto-update
      • Widget display order on a mobile device
    • Working with permissions
      • Granting permissions
      • Deleting permissions
      • Request permissions
    • Working with DataLens Marketplace
      • Adding a product from Marketplace
      • Removing a product from Marketplace
      • Creating and connecting a connector (for partners)
    • Working with organizations
      • Switching between DataLens instances
  • Access management
    • Managing access to DataLens
    • Managing access at the data row level
  • Pricing policy
  • Visualization reference
    • All visualizations
    • Line chart
    • Stacked area chart
    • Normalized stacked area chart
    • Column chart
    • Normalized column chart
    • Bar chart
    • Normalized bar chart
    • Scatter chart
    • Pie chart
    • Indicator
    • Tree chart
    • Donut chart
    • Table
    • Pivot table
    • Map
      • Overview
      • Point map
      • Point map with clusters
      • Polyline map
      • Choropleth map
      • Heat map
    • Combined chart
  • Function reference
    • All Functions
    • Aggregate functions
      • Overview
      • ALL_CONCAT
      • ANY
      • ARG_MAX
      • ARG_MIN
      • AVG
      • AVG_IF
      • COUNT
      • COUNTD
      • COUNTD_APPROX
      • COUNTD_IF
      • COUNT_IF
      • MAX
      • MEDIAN
      • MIN
      • QUANTILE
      • QUANTILE_APPROX
      • STDEV
      • STDEVP
      • SUM
      • SUM_IF
      • TOP_CONCAT
      • VAR
      • VARP
    • Array functions
      • Overview
      • ARRAY
      • ARR_AVG
      • ARR_MAX
      • ARR_MIN
      • ARR_PRODUCT
      • ARR_REMOVE
      • ARR_STR
      • ARR_SUM
      • CAST_ARR_FLOAT
      • CAST_ARR_INT
      • CAST_ARR_STR
      • CONTAINS
      • COUNT_ITEM
      • GET_ITEM
      • REPLACE
      • SLICE
      • STARTSWITH
      • UNNEST
    • Date/Time functions
      • Overview
      • DATEADD
      • DATEPART
      • DATETRUNC
      • DAY
      • DAYOFWEEK
      • HOUR
      • MINUTE
      • MONTH
      • NOW
      • QUARTER
      • SECOND
      • TODAY
      • WEEK
      • YEAR
    • Logical functions
      • Overview
      • CASE
      • IF
      • IFNULL
      • ISNULL
      • ZN
    • Mathematical functions
      • Overview
      • ABS
      • ACOS
      • ASIN
      • ATAN
      • ATAN2
      • CEILING
      • COMPARE
      • COS
      • COT
      • DEGREES
      • DIV
      • EXP
      • FLOOR
      • GREATEST
      • LEAST
      • LN
      • LOG
      • LOG10
      • PI
      • POWER
      • RADIANS
      • ROUND
      • SIGN
      • SIN
      • SQRT
      • SQUARE
      • TAN
    • Operators
      • Overview
      • AND
      • Addition and concatenation (+)
      • BETWEEN
      • Comparison
      • Division (/)
      • IN
      • IS FALSE
      • IS TRUE
      • LIKE
      • Modulo (%)
      • Multiplication (*)
      • NOT
      • Negation (-)
      • OR
      • Power (^)
      • Subtraction (-)
    • String functions
      • Overview
      • ASCII
      • CHAR
      • CONCAT
      • CONTAINS
      • ENDSWITH
      • FIND
      • ICONTAINS
      • IENDSWITH
      • ISTARTSWITH
      • LEFT
      • LEN
      • LOWER
      • LTRIM
      • REGEXP_EXTRACT
      • REGEXP_EXTRACT_NTH
      • REGEXP_MATCH
      • REGEXP_REPLACE
      • REPLACE
      • RIGHT
      • RTRIM
      • SPACE
      • SPLIT
      • STARTSWITH
      • SUBSTR
      • TRIM
      • UPPER
      • UTF8
    • Text markup functions
      • Overview
      • BOLD
      • ITALIC
      • MARKUP
      • URL
    • Time series functions
      • Overview
      • AGO
      • AT_DATE
    • Type conversion functions
      • Overview
      • BOOL
      • DATE
      • DATETIME
      • DATETIME_PARSE
      • DATE_PARSE
      • DB_CAST
      • FLOAT
      • GEOPOINT
      • GEOPOLYGON
      • INT
      • STR
    • Window functions
      • Overview
      • AVG
      • AVG_IF
      • COUNT
      • COUNT_IF
      • FIRST
      • LAG
      • LAST
      • MAVG
      • MAX
      • MCOUNT
      • MIN
      • MMAX
      • MMIN
      • MSUM
      • RANK
      • RANK_DENSE
      • RANK_PERCENTILE
      • RANK_UNIQUE
      • RAVG
      • RCOUNT
      • RMAX
      • RMIN
      • RSUM
      • SUM
      • SUM_IF
    • Function Availability
  • Function tutorials
    • Aggregate functions
    • Window functions
    • LOD expressions and filtering in aggregate functions
  • Public materials
    • Educational projects
    • Webinars and conferences
    • Articles and publications
    • Public dashboards and charts
  • Troubleshooting
    • Questions and answers
    • DataLens errors
  1. Step-by-step instructions
  2. Working with DataLens Marketplace
  3. Creating and connecting a connector (for partners)

Creating and using a connector

Written by
Yandex Cloud
  • How to become a partner
  • Creating a connector
  • Connecting a new user
  • User steps for a connector

If you are a DataLens partner, you can create your own connector (connection type) and add it to DataLens Marketplace or to the connections page. With the help of a connector, users will be able to create datasets, charts, and dashboards from your data.

Advantages of working with a connector for DataLens partners:

  • Easy user access to data.
  • Data access control (each user only sees the data that you make available).
  • Deployment of a ready-made configurable dashboard with your data.

How to become a partner

On the Marketplace home page, click Offer product and complete an application.

After you submit the application, a DataLens manager will contact you.

Provide the DataLens manager with your product information:

  • Name in Russian and English.
  • Description in Russian and English.
  • Use cases in Russian and English.
  • User manual in Russian and English.
  • Icon (vector, SVG).
  • Price and preferred payment method (if your product is fee-based).
  • Developer contacts.

Creating a connector

You need to create a connector in the same CH cluster that will host your user data.

  1. Create a ClickHouse cluster in the cloud.

    1. In the cluster, add a DB user called datalens with readonly = 2.
    2. In the settings, enable DataLens access and Managing databases via SQL.
  2. Pass the password and the cluster host list in to DataLens.

  3. Generate a pair of RSA-2048 keys. Pass the public key and the key version in to DataLens.
    Key generation requirements: public_exponent=65537, key_size=2048. A key version is an integer that is required for future seamless key rotation.

    Python code to generate a pair of keys
    from cryptography.hazmat.primitives.asymmetric import rsa
    from cryptography.hazmat.primitives import serialization
    
    private_key = rsa.generate_private_key(
        public_exponent=65537,
        key_size=2048,
    )
    private_pem = private_key.private_bytes(
        encoding=serialization.Encoding.PEM,
        format=serialization.PrivateFormat.TraditionalOpenSSL,
        encryption_algorithm=serialization.NoEncryption()
    ).decode()
    
    public_key = private_key.public_key()
    public_pem = public_key.public_bytes(
        encoding=serialization.Encoding.PEM,
        format=serialization.PublicFormat.SubjectPublicKeyInfo
    ).decode()
    print(public_pem)
    
  4. DataLens will also provide you with the public part of its key and the key version.
    At this point, DataLens creates a connector to send queries to your ClickHouse cluster.

Connecting a new user

  1. Add databases for your users to the ClickHouse cluster. For every user, create a dedicated database in the ClickHouse cluster. The datalens user's database is granted read access to the database.

  2. Prepare an access token for the user:

    Warning

    Each user must have a separate access token string.

    1. Generate a JSON with the client database name, such as {"db_name":"client_1234383"}.

    2. Encrypt the JSON with the DataLens public key. Encryption parameters: padding scheme PKCS1 v1.5.

    3. Sign the encrypted string with your private key. Signature parameters: padding scheme PKCS1 v1.5, signature hash algorithm: SHA1.

    4. Generate an access token using the following structure <datalens_key_version>:<partner_key_version>:<encrypted_data>:<signature>, where:

      • datalens_key_version and partner_key_version are key versions.
      • encrypted_data is the Base64-encoded encrypted JSON (outcome of step 2.2).
      • signature is the Base64-encoded encrypted message signature (outcome of step 2.3).
    Python code to generate the access token
    import json
    from base64 import b64encode, b64decode
    from cryptography.hazmat.primitives import serialization
    from cryptography.hazmat.primitives import hashes
    from cryptography.hazmat.primitives.asymmetric import padding
    
    public_key_datalens_pem = '''-----BEGIN PUBLIC KEY-----...''' # DataLens public RSA key.
    private_key_partner_pem = '''-----BEGIN RSA PRIVATE KEY-----...''' # Your private RSA key. 
    datalens_key_version, partner_key_version = '1', '1' # Key versions.
    
    data = json.dumps({'db_name': 'db_name_123'}) # JSON with the user database in the ClickHouse cluster.
    
    public_key_datalens = serialization.load_pem_public_key(public_key_datalens_pem.encode())
    private_key_partner = serialization.load_pem_private_key(
        private_key_partner_pem.encode(),
        password=None,
    )
    ciphertext = public_key_datalens.encrypt(data.encode(), padding.PKCS1v15()) # Encrypted JSON message with the user database..
    signature = private_key_partner.sign(ciphertext, padding.PKCS1v15(), hashes.SHA1()) # Encrypted message signature. 
    
    access_token = ':'.join((
        datalens_key_version,
        partner_key_version,
        b64encode(ciphertext).decode(encoding='utf-8'),
        b64encode(signature).decode(encoding='utf-8'),
    ))
    
  3. Deliver the access token to the user through your website or some other way.

User steps for a connector

  1. Gets an access token for DataLens on your website.

  2. Goes to DataLens Marketplace, purchases a connector, or activates a free product.

  3. Goes to the connections DataLens page and selects an activated connector from the list.

  4. Enters the access token you provided on the page where you create new connections. Doing this links the connection to the database whose name is encrypted in the access token.

    Example for connecting

    image

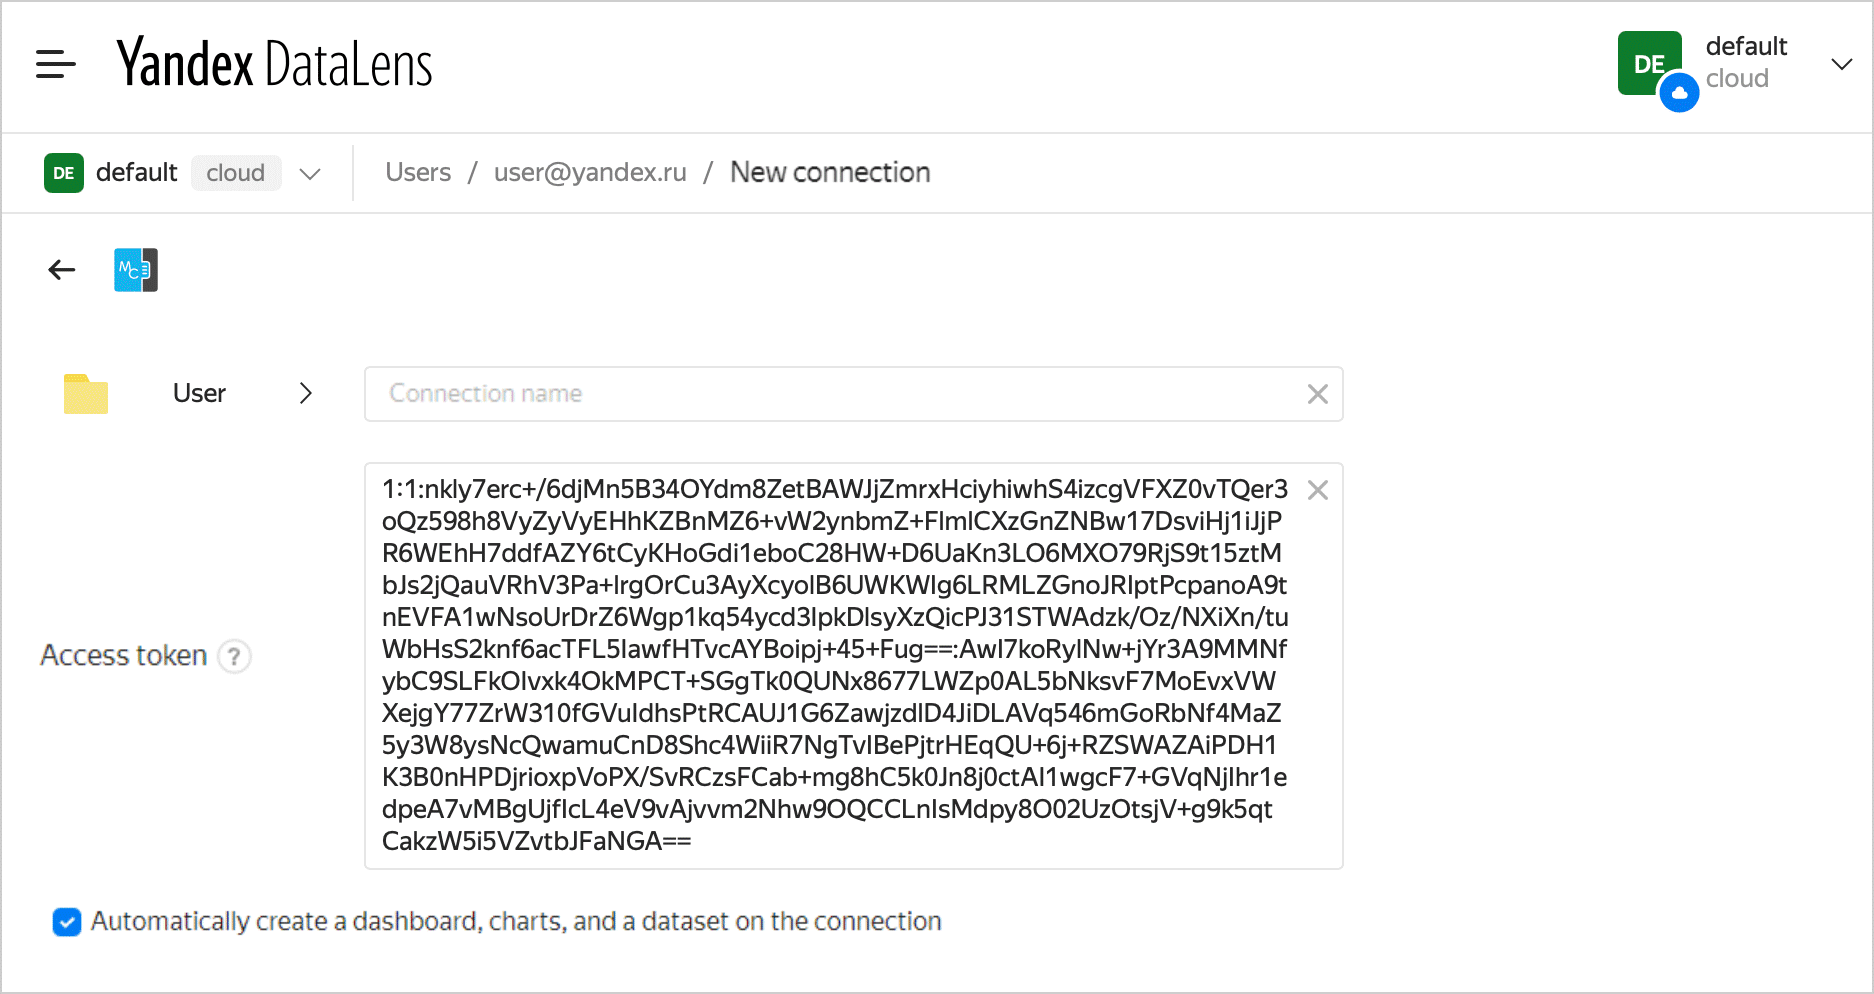
  5. Saves the connection. At this point, DataLens deploys a standard dashboard based on connector data.

See also

  • Marketplace

Was the article helpful?

Language / Region
Yandex project
© 2023 Yandex.Cloud LLC
In this article:
  • How to become a partner
  • Creating a connector
  • Connecting a new user
  • User steps for a connector