SQL queries in Managed Service for ClickHouse®
Managed Service for ClickHouse® allows you to visualize the data structure in your ClickHouse® cluster and send SQL queries to databases from the Yandex Cloud management console. To do this, log in to the management console, open the cluster page you need, and go to the SQL tab.
See a reference list of supported queries in the ClickHouse® documentation.
Warning
The SQL editor built into the management console is designed for a narrow range of data editing tasks. Some parameter values can be replaced by the editor's defaults.
For working with databases, we recommend third-party editors or Yandex WebSQL. To use Yandex WebSQL, click Open on a promo banner and connect to a DB cluster.
Access to the cluster from the management console
To connect to a Managed Service for ClickHouse® cluster from the management console and operate its data, enable the Access from the management console option when creating a cluster or updating its settings.
Authentication
Every time you open the SQL tab, you must enter the username and password of the cluster user. This opens the cluster data structure and the SQL query input window.
Tip
To avoid entering the password too often, open this page of the management console in a new browser tab.
Data structure visualization
Once you have logged in, you can see the structure of the databases and tables in the cluster:
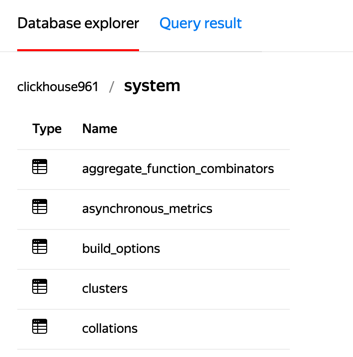
Click on the table to see the first 1000 rows of the SELECT * query result for this table (the console doesn't support full navigation through all the DB data). Hover over the column header to see the type of column data:
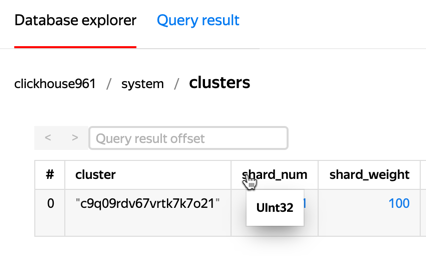
In the Query result offset field, you can set the offset for showing the results table. A maximum of 20 rows can be displayed on a single page. Use the < and > buttons to quickly increase and decrease the offset by 20.
SQL queries
The query input window is open on the right. Start typing your query to see suggested keyword options:
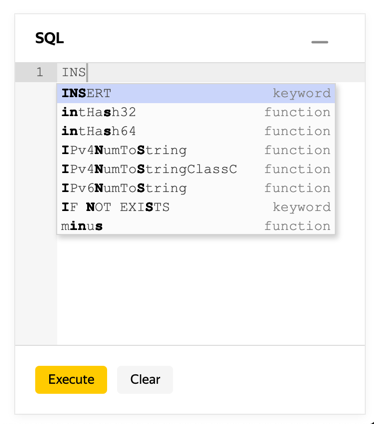
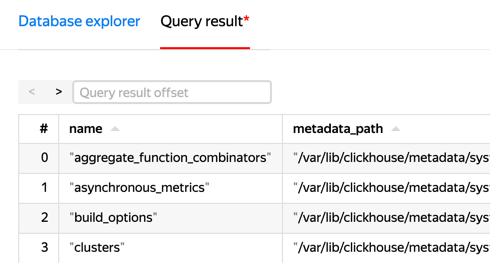
Enter a query and click Execute. The results table or an error message will show in the results panel under the buttons.
Query restrictions in the management console
The main query restriction in the management console is that the text of queries and their results are available only until you close or reload the page in your browser. But if a query was run successfully, Managed Service for ClickHouse® processes it regardless of the state of the management console.
In addition, keep the following in mind:
- The management console will only display the first 1000 rows of results, even if there is actually more data.
- When a cluster query takes more than 10 minutes to complete, the management console will report an error as a result, even if the query was eventually processed successfully.
- If your cluster has multiple ClickHouse® hosts, queries from the management console are sent to a random one. Keep this in mind if you are going to modify data. For example, the
CREATE TABLE db1.newtablequery creates a table on one host only. To avoid this, use a distributed query, putting your cluster name inside the curly brackets:CREATE TABLE db1.newtable ON CLUSTER '{cluster}'. - SQL queries in the management console are executed separately, without creating a session shared with the ClickHouse® server. Therefore, queries running within a session have no impact. For example, this is true for such queries as
USEorSET.
ClickHouse® is a registered trademark of ClickHouse, Inc.