Chart inspector
If a dashboard includes many charts that take a long time to load and process data, this may slow down the performance of the entire dashboard. You can analyze chart performance with an inspector.
A chart inspector is a DataLens tool that helps you troubleshoot issues when loading data and rendering them on a browser. You can use it to determine why a chart is slow or optimize data fetching and chart rendering.
To open the chart inspector, click in the top-right corner of the chart and select Inspector.
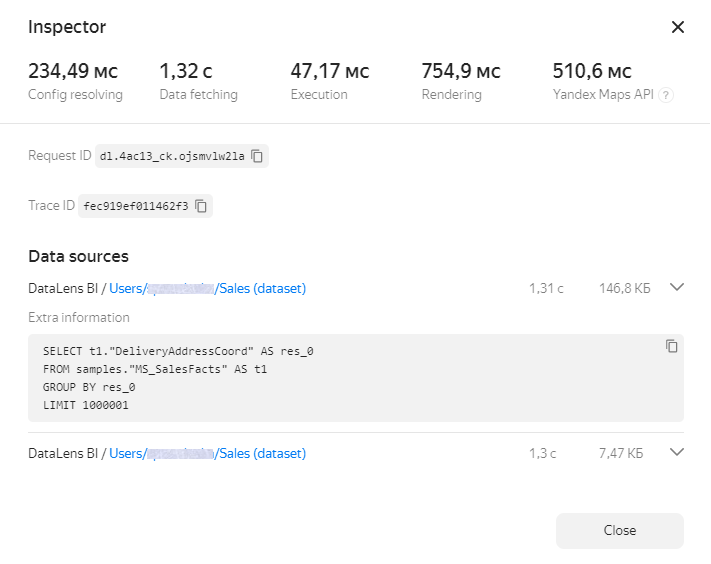
At the top of the inspector window, there is information on the speed of basic operations:
- Config resolving: Chart configuration load time.
- Data fetching: Time it takes to load data from the source.
- Execution: Time to process data received from the source.
- Rendering: Time to render data on a chart.
Values above the optimal level are highlighted in either orange or red. To get recommendations for optimizing a metric, hover over the question mark next to its name.
For some chart types, additional metrics are displayed:
- Columns / Rows: Number of table columns and rows (for Table and Pivot table charts).
- Yandex Maps API: Time to load modules required by Yandex Maps (for Map charts).
The inspector also displays source request IDs and trace IDs.
The Data sources section displays information about the sources used in a chart:
- Source name.
- Link to source.
- Request body in JSON format.
- SQL query text sent to source (only if the SQL query is successful and its results are rendered in the chart).