Combining data from multiple tables
When multiple source tables are available, you can combine their data:
Warning
If you use a new DataLens object model with workbooks and collections:
- In the left-hand panel, select Collections and workbooks.
- Open the appropriate workbook and select an object.
Follow the guide from step 2.
-
In the left-hand panel, click Datasets and select the dataset you need. If you do not have a dataset, create one.
-
In the top-left corner, select the Sources tab.
-
Under Tables, select a table and drag it to your workspace.
-
Select another table and drag it to your workspace. A link will automatically be created between these tables based on the first matching field name and field data type.
-
To edit this table link:
-
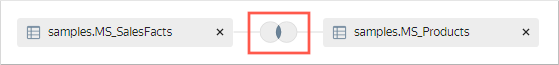
Click the table link icon.
-
Select the join type:
inner,left,right, orfull. -
Select the fields to join the tables on. You can only link fields with the same data type.
-
If required, link other fields in the tables. To do this, click Add link.
-
Click Apply.
-
-
Repeat steps 4 and 5 to add tables.
-
When the third and subsequent tables are added, link are automatically created to the first table in the workspace.
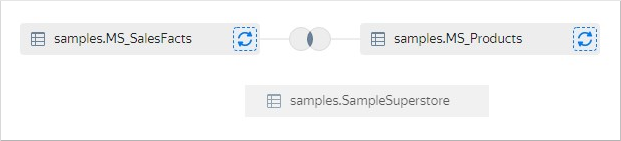
A link will automatically be created between these tables based on the first matching field name and field data type.
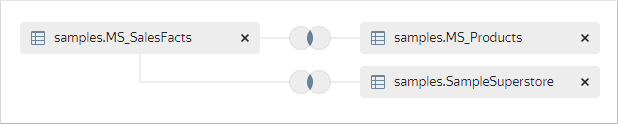
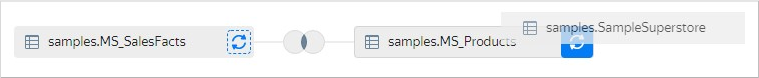
When dragging a new table to the workspace, you can explicitly specify which table to link it to. Hover the new table over a previously added one to have a gray border display around the latter and release.
A new link to the specified table is created.

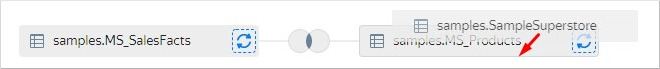
You can replace a previously added table. When dragging a new table, hover it over the icon with circular arrows to the right of the table being replaced to turn the icon background blue, then release.
-
Click Save.
You can add data to a dataset using an SQL query and combine this data with other tables.