Uploading audit logs to Managed Service for ClickHouse® and data visualization in DataLens

Upload management event audit logs from a folder to Yandex Managed Service for ClickHouse® and analyze the resource use in Yandex DataLens.
- Prepare your cloud.
- Prepare the environment.
- Create a trail.
- Create a source endpoint for a Yandex Data Streams data stream.
- Create a target endpoint for a ClickHouse® database.
- Create a transfer.
- Visualize your data in DataLens.
If you no longer need the resources you created, delete them.
Getting started
Sign up for Yandex Cloud and create a billing account:
- Go to the management console and log in to Yandex Cloud or create an account if you do not have one yet.
- On the Yandex Cloud Billing page, make sure you have a billing account linked and it has the
ACTIVEorTRIAL_ACTIVEstatus. If you do not have a billing account, create one.
If you have an active billing account, you can go to the cloud page to create or select a folder to run your infrastructure.
Learn more about clouds and folders.
Required paid resources
The infrastructure support cost includes:
- Fee for using a data stream (see Data Streams pricing).
- Fee for a continuously running Managed Service for ClickHouse® cluster (see Managed Service for ClickHouse® pricing).
Prepare the environment
Create a service account and assign roles
- In the management console, select a folder where you want to create a service account.
- At the top of the screen, go to the Service accounts tab.
- Click Create service account.
- Enter the service account name:
sa-trail-logs. - Click Add role and select the
audit-trails.viewerandyds.editorroles. - Click Create.
If you do not have the Yandex Cloud command line interface yet, install and initialize it.
The folder specified in the CLI profile is used by default. You can specify a different folder using the --folder-name or --folder-id parameter.
-
Create a service account with the name
sa-trail-logs:yc iam service-account create --name sa-trail-logsResult:
id: aje6o61*****h6g9a33s
folder_id: b1gvmob*****aplct532
created_at: "2022-07-25T18:01:25Z"
name: sa-trail-logs
For more information about the
yc iam service-account createcommand, see the CLI reference. -
Assign the service account the
audit-trails.viewerrole:yc resource-manager folder add-access-binding <folder_name> \ --role audit-trails.viewer \ --subject serviceAccount:<service_account_ID>Where:
--role: Role being assigned.--subject: ID of thesa-trail-logsservice account.
For more information about the
yc resource-manager folder add-access-bindingcommand, see the CLI reference. -
Assign the service account the
yds.editorrole:yc resource-manager folder add-access-binding <folder_name> \ --role yds.editor \ --subject serviceAccount:<service_account_ID>Where:
--role: Role being assigned.--subject: ID of thesa-trail-logsservice account.
If you don't have Terraform, install it and configure the Yandex Cloud provider.
-
In the configuration file, describe the service account parameters:
resource "yandex_iam_service_account" "sa" {
  name = "sa-trail-logs"
}

 resource "yandex_resourcemanager_folder_iam_member" "sa-role-audit-viewer" {
   folder_id   = "<folder_ID>"
   role        = "audit-trails.viewer"
   member      = "serviceAccount:<service_account_ID>"
 }

 resource "yandex_resourcemanager_folder_iam_member" "sa-role-yds-editor" {
   folder_id   = "<folder_ID>"
   role        = "yds.editor"
   member      = "serviceAccount:<service_account_ID>"
 }
Where:
role: Role being assigned.member: ID of thesa-trail-logsservice account.
For more information about resources you can create using Terraform, see the provider documentation.
-
Make sure the configuration files are correct.
-
In the command line, go to the directory where you created the configuration file.
-
Run a check using this command:
terraform plan
If the configuration is described correctly, the terminal will display a list of created resources and their parameters. If the configuration contains any errors, Terraform will point them out.
-
-
Deploy cloud resources.
-
If the configuration does not contain any errors, run this command:
terraform apply -
Confirm creating the resources: type
yesin the terminal and press Enter.
-
-
Create a service account using the create method for the ServiceAccount resource.
-
Find out the service account ID:
export FOLDER_ID=<folder_ID>
export IAM_TOKEN=<IAM_token>
curl -H "Authorization: Bearer ${IAM_TOKEN}" \
  "https://iam.api.cloud.yandex.net/iam/v1/serviceAccounts?folderId=${FOLDER_ID}"
Result:
{ "serviceAccounts": [ { "id": "aje6o61*****h6g9a33s", "folderId": "b1gvmob*****aplct532", "createdAt": "2022-07-25T18:01:25Z", "name": "sa-trail-logs" } ] } -
Create a request body in the
body.jsonfile. Set theactionproperty toADDand specify theserviceAccounttype andsa-trail-logsservice account ID in thesubjectproperty:body.json:
{
 "accessBindingDeltas": [
  {
   "action": "ADD",
   "accessBinding": {
     "roleId": "audit-trails.viewer",
     "subject": {
       "id": "<service_account_ID>",
       "type": "serviceAccount"
       }
     }
   },
   {
    "action": "ADD",
    "accessBinding": {
      "roleId": "yds.writer",
      "subject": {
        "id": "<service_account_ID>",
        "type": "serviceAccount"
        }
      }
   }
 ]
}
Where:
roleId: Role being assigned.id: ID of thesa-trail-logsservice account.
-
Assign roles to the service account:
export FOLDER_ID=<folder_ID>
export IAM_TOKEN=<IAM_token>
curl -X POST \
  -H "Content-Type: application/json" \
  -H "Authorization: Bearer ${IAM_TOKEN}" \
  -d '@body.json' \
  "https://resource-manager.api.cloud.yandex.net/resource-manager/v1/folders/${FOLDER_ID}:updateAccessBindings"
Create a ClickHouse® cluster
- On the folder page in the management console, click Create resource and select ClickHouse cluster.
- Specify the settings for a ClickHouse® cluster:
- Under Basic parameters, enter the cluster name:
trail-logs. - Under Resources, select the
burstableVM type and theb2.mediumhost type. - Under DBMS settings, enter
trail_datafor DB name,userfor username, and the password. Remember the database name. - Under Hosts, click . Enable the Public access option and click Save.
- Under Service settings, enable the following options:
- Access from DataLens
- Access from the management console
- Access from Yandex Data Transfer
- Under Basic parameters, enter the cluster name:
- After configuring all settings, click Create cluster.
-
Check whether the folder has any subnets for the cluster hosts:
yc vpc subnet listIf there are no subnets in the folder, create the required subnets inYandex Virtual Private Cloud.
-
Specify the cluster parameters in the create command:
yc managed-clickhouse cluster create \
  --name trail-logs \
  --environment production \
  --network-name <network_name> \
  --host type=clickhouse,zone-id=<availability_zone>,subnet-id=<subnet_ID> \
  --clickhouse-resource-preset b2.medium \
  --clickhouse-disk-type network-hdd \
  --clickhouse-disk-size 10 \
  --user name=user,password=<user_password> \
  --database name=trail_data \
  --datalens-access=true \
  --datatransfer-access=true \
  --websql-access=true
For more information about the yc managed-clickhouse cluster create command, see the CLI reference.
-
Add a description of the cluster and cluster hosts to the configuration file:
resource "yandex_mdb_clickhouse_cluster" "trail-logs" {
  name                = "trail-logs"
  environment         = "PRODUCTION"
  network_id          = yandex_vpc_network.<network_name_in_Terraform>.id

  clickhouse {
    resources {
      resource_preset_id = "b2.medium"
      disk_type_id       = "network-hdd"
      disk_size          = 10
    }
  }

  database {
    name = "trail_data"
  }

  user {
    name     = "user"
    password = "<password>"
    permission {
      database_name = "trail_data"
    }
  }

  host {
    type      = "CLICKHOUSE"
    zone      = "<availability_zone>"
    subnet_id = yandex_vpc_subnet.<subnet_name_in_Terraform>.id
  }

  access {
    data_lens     = true
    data_transfer = true
  }
}
For more information about the resources you can create with Terraform, see the provider documentation.
-
Make sure the configuration files are correct.
-
In the command line, go to the directory where you created the configuration file.
-
Run a check using this command:
terraform plan
If the configuration is described correctly, the terminal will display a list of created resources and their parameters. If the configuration contains any errors, Terraform will point them out.
-
-
Deploy cloud resources.
-
If the configuration does not contain any errors, run this command:
terraform apply -
Confirm creating the resources: type
yesin the terminal and press Enter.
-
Use the create REST API method.
Create a data stream
A data stream is used to upload audit logs.
- On the folder page in the management console, click Create resource and select Data Streams.
- In the Database field, click Create new. A new Managed Service for YDB database creation page will open.
- Enter the database Name:
stream-db. - In the Database type field, select
Serverless. - Click Create a database.
- Return to the stream creation page. Click and select the created DB from the list.
- Enter the data stream name:
trail-logs-stream. - Click Create.
Wait for the stream to start. Once the stream is ready for use, its status will change from Creating to Active.
Create a trail
A trail will be uploading management event audit logs for all the resources in your folder to a Data Streams stream.
- On the folder page in the management console, click Create resource and select Audit trail.
- Enter the name of the created trail:
folder-trail. - Under Destination, set up the destination object:
- Destination:
Data Streams. - Data stream: Select the
trail-logs-streamdata stream.
- Destination:
- Under Service account, select the
sa-trail-logsservice account. - Under Collecting events from the configuration level (Control plane), set up the collection of management event audit logs:
- Collecting events: Select
Enabled. - Resource: Select
Folder. - Folder: Automatically populated field showing the name of the folder to host the trail.
- Collecting events: Select
- Under Collecting events from the service level (Data plane), select
Disabledin the Collecting events field. - Click Create.
Create a source endpoint for a Data Streams data stream
To create a transfer, you need to specify the source endpoint that leads to a Data Streams stream.
- Go to the folder page and select Data Transfer.
- In the left-hand panel, select Endpoints.
- Click Create endpoint.
- In the Direction field, select
Source. - Enter the endpoint name:
source-logs-stream. - In the Database type field, select
Yandex Data Streams. - Configure the endpoint parameters:
- Database: Select the DB registered for the
trail-logs-stream. - Stream:
trail-logs-stream - Service account:
sa-trail-logs
- Database: Select the DB registered for the
- Set up conversion rules:
-
Data format:
JSON -
Data scheme:
Field listSpecify the list of fields from the table below:
Name Type Key Required Path event_id STRING - - event_id event_source STRING - - event_source event_type STRING - - event_type event_time DATETIME - - event_time authenticated ANY - - authentication.authenticated subject_type STRING - - authentication.subject_type subject_id STRING - - authentication.subject_id subject_name STRING - - authentication.subject_name authorized ANY - - authorization.authorized resource_metadata ANY - - resource_metadata remote_address STRING - - request_metadata.remote_address user_agent STRING - - request_metadata.user_agent request_id STRING - - request_metadata.request_id event_status STRING - - event_status details ANY - - details -
Enable Add a column for missing keys.
-
- Click Create.
Create a target endpoint for a ClickHouse® database
To create a transfer, you need to specify the target endpoint with ClickHouse® database settings.
- Go to the folder page and select Data Transfer.
- In the left-hand panel, select Endpoints.
- Click Create endpoint.
- In the Direction field, select
Target. - Enter the endpoint name:
target-logs-ch. - In the Database type field, select
ClickHouse®. - Under Endpoint parameters, specify:
- Connection type: Managed cluster. Select the
trail-logscluster. - User:
user. - Password: Enter the DB user password.
- Database:
trail_data.
- Connection type: Managed cluster. Select the
- Click Create.
Create a transfer
A transfer will migrate data between the source service (a stream) and the target service (a ClickHouse® database).
- Go to the folder page and select Data Transfer.
- In the left-hand panel, select Transfers.
- Click Create transfer.
- Enter the transfer name:
logs-transfer. - Select the endpoint for the source:
source-logs-stream. - Select the endpoint for the target:
target-logs-ch. - Click Create.
- Click next to the name of the transfer and select Activate.
- Wait until the transfer status changes to
Replicating.
Create a transfer named logs-transfer:
yc datatransfer transfer create --name logs-transfer
  --source-id <source_endpoint_ID>
  --target-id <target_endpoint_ID>
  --type increment-only
Where:
--source-id: ID of thesource-logs-streamsource endpoint.--target-id: ID of thetarget-logs-chtarget endpoint.
For more information about the yc datatransfer transfer create command, see the CLI reference.
-
Add a transfer description to the configuration file.
resource "yandex_datatransfer_transfer" "transfer" {
  folder_id   = "<folder_ID>"
  name        = "logs-transfer"
  source_id   = "<source_endpoint_ID>"
  target_id   = "<target_endpoint_ID>"
  type        = "INCREMENT_ONLY"
}
Where:
source_id: ID of thesource-logs-streamsource endpoint.target_id: ID of thetarget-logs-chtarget endpoint.
For more information about the resources you can create with Terraform, see the provider documentation.
-
Make sure the configuration files are correct.
-
In the command line, go to the directory where you created the configuration file.
-
Run a check using this command:
terraform plan
If the configuration is described correctly, the terminal will display a list of created resources and their parameters. If the configuration contains any errors, Terraform will point them out.
-
-
Deploy cloud resources.
-
If the configuration does not contain any errors, run this command:
terraform apply -
Confirm creating the resources: type
yesin the terminal and press Enter.
-
After enabling the transfer, go to Managed Service for ClickHouse® and make sure the trail_logs_stream table with Yandex Audit Trails events is present in the trail_data database.
You can run queries to the trail_data database to search for security events of interest.
-
To find out who deleted a folder:
select * from trail_data.trail_logs_stream where event_type = 'yandex.cloud.audit.resourcemanager.DeleteFolder' and JSONExtractString(details, 'folder_name') = '<folder_name>' -
What actions a specific user performed over a period of time (the user's name ID and date are required):
select * from trail_data.trail_logs_stream where subject_name = '<user_name_ID>' and event_time >= 2022-06-26 -
Trigger when creating keys for service accounts:
select * from trail_data.trail_logs_stream
where event_type = 'yandex.cloud.audit.iam.CreateAccessKey' or event_type = 'yandex.cloud.audit.iam.CreateKey' or event_type = 'yandex.cloud.audit.iam.CreateApiKey'
All events of interest are collected in the solution.
Visualize your data in DataLens
To visualize data, you need to connect to the ClickHouse® database where the logs were moved and create a dataset based on the data there.
Create a connection
- Go to the DataLens home page.
- In the window that opens, click Create connection.
- Select a ClickHouse® connection.
- Select the Select in folder connection type and enter the connection settings:
- In the Cluster field, select
trail-logs. - In the Host name field, select the ClickHouse® host from the drop-down list.
- Enter the DB user name and password.
- In the Cluster field, select
- Click Check connection.
- After checking the connection, click Create connection.
- Enter
trail-logs-confor the connection name, and click Create. - After saving the connection, in the top-right corner, click Create dataset.
Create a dataset
- Drag the
trail_data.trail_logs_streamtable from the Tables section on the left of the screen to the workspace. - In the top-right corner, click Save.
- Enter
trail-logs-datasetfor the dataset name, and click Create. - When the dataset is saved, click Create chart in the top-right corner.
Create a line chart
To display the number of events for each source, create a line chart:
- For the visualization type, select Line chart.
- Drag the
event_sourcefield from the Dimensions section to the Y section. - Drag the
event_idfield from the Dimensions section to the X section. - Drag the
event_sourcefield from the Dimensions section to the Colors section. - In the top-right corner, click Save.
- In the window that opens, enter the
Trail logs: eventsname for the chart and click Save.
Create a pie chart
To show numerical proportion by event status, create a pie chart:
- Copy the chart from the previous step:
- In the top-right corner, click the down arrow next to the Save button.
- Click Save as.
- In the window that opens, enter the
Trail logs: statusesname for the new chart and click Save.
- For the visualization type, select Pie chart. The
event_sourceandevent_idare automatically copied to the Color and Measures sections, respectively. - Delete the
event_sourcefield from the Color section and drag theevent_statusfield there. - In the top-right corner, click Save.
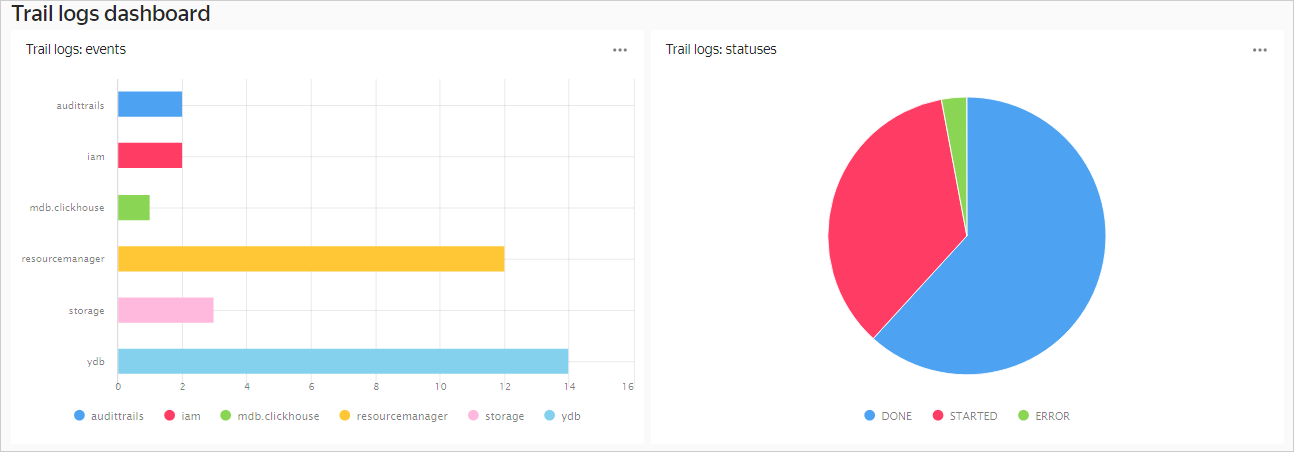
Create a dashboard and add charts there
Create a dashboard to add charts to:
- Go to the DataLens home page.
- Click Create dashboard.
- Enter
Trail logs dashboardfor the dashboard name and click Create. - In the top-right corner, click Add and choose Chart.
- In the Chart field, click Select and choose the
Trail logs: eventschart from the list. - Click Add. The chart will be displayed on the dashboard.
- Repeat the previous steps for the
Trail logs: statuseschart. - In the top-right corner, click Save.
Example dashboard:
How to delete the resources you created
Some resources are not free of charge. To avoid paying for them, delete the resources you no longer need:
- Delete the cluster named
trail-logs. - Delete the stream named
trail-logs-stream. - Delete endpoints for both the source and target.
- Delete the transfer named
logs-transfer.
ClickHouse® is a registered trademark of ClickHouse, Inc.